Chapter 1
Basics
Instruction of the workflows.
Instruction of the workflows.
Nextflow will need java 11 or higher to be installed. The recommanded way to install java is through SDKMAN. Please use the command below:
Install SDKMAN:
curl -s https://get.sdkman.io | bashOpen a new terminal and install Java
sdk install java 17.0.10-temCheck java installation and comfirm it’s version
java -versionNextflow binary was already included in the StarScope directory. User also could download binary from nextflow’s github release page.
By default, starscope will invoke the nextflow executable stored in the same directory, user
could add both of the two executables to $PATH (e.g. ~/.local/bin)
## starscope executable
ln -s starscope/starscope ~/.local/bin/starscope

## nextflow
ln -s starscope/nextflow ~/.local/bin/nextflow
Confirm that nextflow runs properly with the command below (require network access to github):
NXF_VER=23.10.1 nextflow run helloThe output will be:
N E X T F L O W ~ version 22.04.5
Launching `https://github.com/nextflow-io/hello` [distraught_ride] DSL2 - revision: 4eab81bd42 [master]
executor > local (4)
[92/5fbfca] process > sayHello (4) [100%] 4 of 4 ✔
Bonjour world!

Hello world!

Ciao world!

Hola world!We usually use miniforge’s conda distro, user also could install via conda official installer, or use mamba directly, which is much faster.
Miniforge:
wget -c https://github.com/conda-forge/miniforge/releases/download/24.3.0-0/Mambaforge-24.3.0-0-Linux-x86_64.sh
bash Mambaforge-24.3.0-0-Linux-x86_64.sh
Official minicoda:
wget -c wget -c https://repo.anaconda.com/miniconda/Miniconda3-latest-Linux-x86_64.sh
bash Miniconda3-latest-Linux-x86_64.sh
Micromamba, user may need to put micromamba binary into $PATH
# Linux Intel (x86_64):
curl -Ls https://micro.mamba.pm/api/micromamba/linux-64/latest | tar -xvj bin/micromambaOne could create conda environment with the yaml file in the workflow directory.
## scRNA-seq/VDJ environment
mamba env create -f starscope/scRNA-seq/scRNAseq_env.yml

## scATAC-seq environment
mamba env create -f starscope/scATAC-seq/scATAC_env.yml
Or extract environment from archive distributed by ThunderBio with conda-pack
# Unpack environment into directory `starscope_env`
$ mkdir -p starscope_env
$ tar -xzf starscope_env.tar.gz -C starscope_env
# Activate the environment. This adds `starscope_env/bin` to your path
$ source starscope_env/bin/activate
# Cleanup prefixes from in the active environment.
# Note that this command can also be run without activating the environment
# as long as some version of Python is already installed on the machine.
(starscope_env) $ conda-unpack
# deactivete env
$ source starscope_env/bin/deactivateUsing docker is much easier to integrate the workflow to large infrastructure like cloud platforms or HPC, thus is recommended. To install:
curl -fsSL https://get.docker.com -o get-docker.sh
sh get-docker.sh
To use docker command without sudo, add your account to docker group:
sudo usermod -aG docker $(whoami)Then log out and login again for the changes to take effect.
Please pull the pre-built image with:
## scATAC-seq image
docker pull registry-intl.cn-hangzhou.aliyuncs.com/thunderbio/starscope_scatac_env:latest

## scRNA-seq/VDJ image
docker pull registry-intl.cn-hangzhou.aliyuncs.com/thunderbio/starscope_scrnaseq_env:latestAfter invoking the pipeline, nextflow will report the progress to stdout, with each row representing a process.
N E X T F L O W  ~  version 23.10.1
Launching `/thunderData/pipeline/starscope/scRNA-seq/main.nf` [adoring_ekeblad] DSL2 - revision: 8e27902b23
executor >  slurm (9)
[e0/1d00d4] process > scRNAseq:CAT_FASTQ (human_test)        [100%] 1 of 1 ✔
[37/8c0795] process > scRNAseq:TRIM_FASTQ (human_test)       [100%] 1 of 1 ✔
[20/1edf9b] process > scRNAseq:MULTIQC (human_test)          [100%] 1 of 1 ✔
[5a/e0becc] process > scRNAseq:STARSOLO (human_test)         [100%] 1 of 1 ✔
[02/15a3b1] process > scRNAseq:CHECK_SATURATION (human_test) [100%] 1 of 1 ✔
[09/e25428] process > scRNAseq:GET_VERSIONS (get_versions)   [100%] 1 of 1 ✔
[48/703c20] process > scRNAseq:FEATURESTATS (human_test)     [100%] 1 of 1 ✔
[79/cd2784] process > scRNAseq:GENECOVERAGE (human_test)     [100%] 1 of 1 ✔
[e6/808adf] process > scRNAseq:REPORT (human_test)           [100%] 1 of 1 ✔
Completed at: 09-May-2024 09:07:55
Duration    : 25m 9s
CPU hours   : 3.7
Succeeded   : 9
When encountering any error, nextflow will interrupt running and print error message to stderr directly.
User could also check the error message from running log file .nextflow.log
$ head .nextflow.log

May-09 08:42:37.523 [main] DEBUG nextflow.cli.Launcher - $> nextflow run /thunderData/pipeline/starscope/scRNA-seq -c /thunderData/pipeline/nf_scRNAseq_config/latest/thunderbio_human_config --input sampleList.csv
May-09 08:42:37.924 [main] INFO  nextflow.cli.CmdRun - N E X T F L O W  ~  version 23.10.1
May-09 08:42:38.096 [main] DEBUG nextflow.plugin.PluginsFacade - Setting up plugin manager > mode=prod; embedded=false; plugins-dir=/home/xzx/.nextflow/plugins; core-plugins: nf-amazon@2.1.4,nf-azure@1.3.3,nf-cloudcache@0.3.0,nf-codecommit@0.1.5,nf-console@1.0.6,nf-ga4gh@1.1.0,nf-google@1.8.3,nf-tower@1.6.3,nf-wave@1.0.1
May-09 08:42:38.147 [main] INFO  o.pf4j.DefaultPluginStatusProvider - Enabled plugins: []
May-09 08:42:38.150 [main] INFO  o.pf4j.DefaultPluginStatusProvider - Disabled plugins: []
May-09 08:42:38.163 [main] INFO  org.pf4j.DefaultPluginManager - PF4J version 3.4.1 in 'deployment' mode
May-09 08:42:38.234 [main] INFO  org.pf4j.AbstractPluginManager - No plugins
May-09 08:42:42.225 [main] DEBUG nextflow.config.ConfigBuilder - Found config base: /thunderData/pipeline/starscope/scRNA-seq/nextflow.config
May-09 08:42:42.231 [main] DEBUG nextflow.config.ConfigBuilder - User config file: /thunderData/pipeline/nf_scRNAseq_config/latest/thunderbio_human_config_v2
May-09 08:42:42.233 [main] DEBUG nextflow.config.ConfigBuilder - Parsing config file: /thunderData/pipeline/starscope/scRNA-seq/nextflow.configAfter each invokation, the pipeline running information could be retrieved by nextflow log
command, and user could check the RUN NAME, STATUS and SESSION ID from the command output.
$ nextflow log

TIMESTAMP          	DURATION	RUN NAME       	STATUS	REVISION ID	SESSION ID                          	COMMAND
2024-05-09 08:42:44 25m 12s adoring_ekeblad OK 8e27902b23 8670925f-ce5a-4f7a-b327-a98b288e6aa6 nextflow run /thunderData/pipeline/starscope/scRNA-seq -c /thunderData/pipeline/nf_scRNAseq_config/latest/thunderbio_human_config --input sampleList.csvEach task of the process will be conducted in a sub-directory of the workDir set in
nextflow configuration file. By default, StarScope set this to work folder
under project running directory. To confirm each tasks’ working directory, user
will have to check the task hash id with command below. The adoring_ekeblad is
the RUN NAME from nextflow log output.
$ nextflow log adoring_ekeblad -f hash,name,exit,status

e0/1d00d4	scRNAseq:CAT_FASTQ (human_test)	0	COMPLETED
09/e25428	scRNAseq:GET_VERSIONS (get_versions)	0	COMPLETED
37/8c0795	scRNAseq:TRIM_FASTQ (human_test)	0	COMPLETED
20/1edf9b	scRNAseq:MULTIQC (human_test)	0	COMPLETED
5a/e0becc	scRNAseq:STARSOLO (human_test)	0	COMPLETED
79/cd2784	scRNAseq:GENECOVERAGE (human_test)	0	COMPLETED
48/703c20	scRNAseq:FEATURESTATS (human_test)	0	COMPLETED
02/15a3b1	scRNAseq:CHECK_SATURATION (human_test)	0	COMPLETED
e6/808adf	scRNAseq:REPORT (human_test)	0	COMPLETED
To check CAT_FASTQ process task working directory, we could use it’s hash_id (e0/1d00d4) to
locate the folder in work:
$ ls -a work/e0/1d00d49d7d562790a4d4f5993852ba/

.   .command.begin  .command.log  .command.run  .command.trace  human_test_1.merged.fq.gz  human_test.R1.fq.gz
..  .command.err    .command.out  .command.sh   .exitcode       human_test_2.merged.fq.gz  human_test.R2.fq.gz
The work directory always contains several important hidden files:
.command.out STDOUT from tool..command.err STDERR from tool..command.log contains both STDOUT and STDERR from tool..command.begin created as soon as the job launches..exitcode created when the job ends, with exit code..command.trace logs of compute resource usage..command.run wrapper script used to run the job..command.sh process command used for this task.$ cat work/e0/1d00d49d7d562790a4d4f5993852ba/.command.sh
#!/bin/bash -ue
ln -s human_test.R1.fq.gz human_test_1.merged.fq.gz
ln -s human_test.R2.fq.gz human_test_2.merged.fq.gzThe nextflow pipeline could be execute in background, with -bg option:
starscope gex --input sampleList.csv --config custom_config -bgOne of the core features of Nextflow is the ability to cache task executions and re-use them in subsequent runs to minimize duplicate work. Resumability is useful both for recovering from errors and for iteratively developing a pipeline. It is similar to checkpointing, a common practice used by HPC applications.
To resume from previous run, please use the command below after entering the project running directory:
starscope gex --input sampleList.csv --config custom_config -bg -resumeOr resume from a specific run with session ID (check from nextflow log output):
starscope gex --input sampleList.csv --config custom_config -bg -resume 8670925f-ce5a-4f7a-b327-a98b288e6aa6Additional resources:
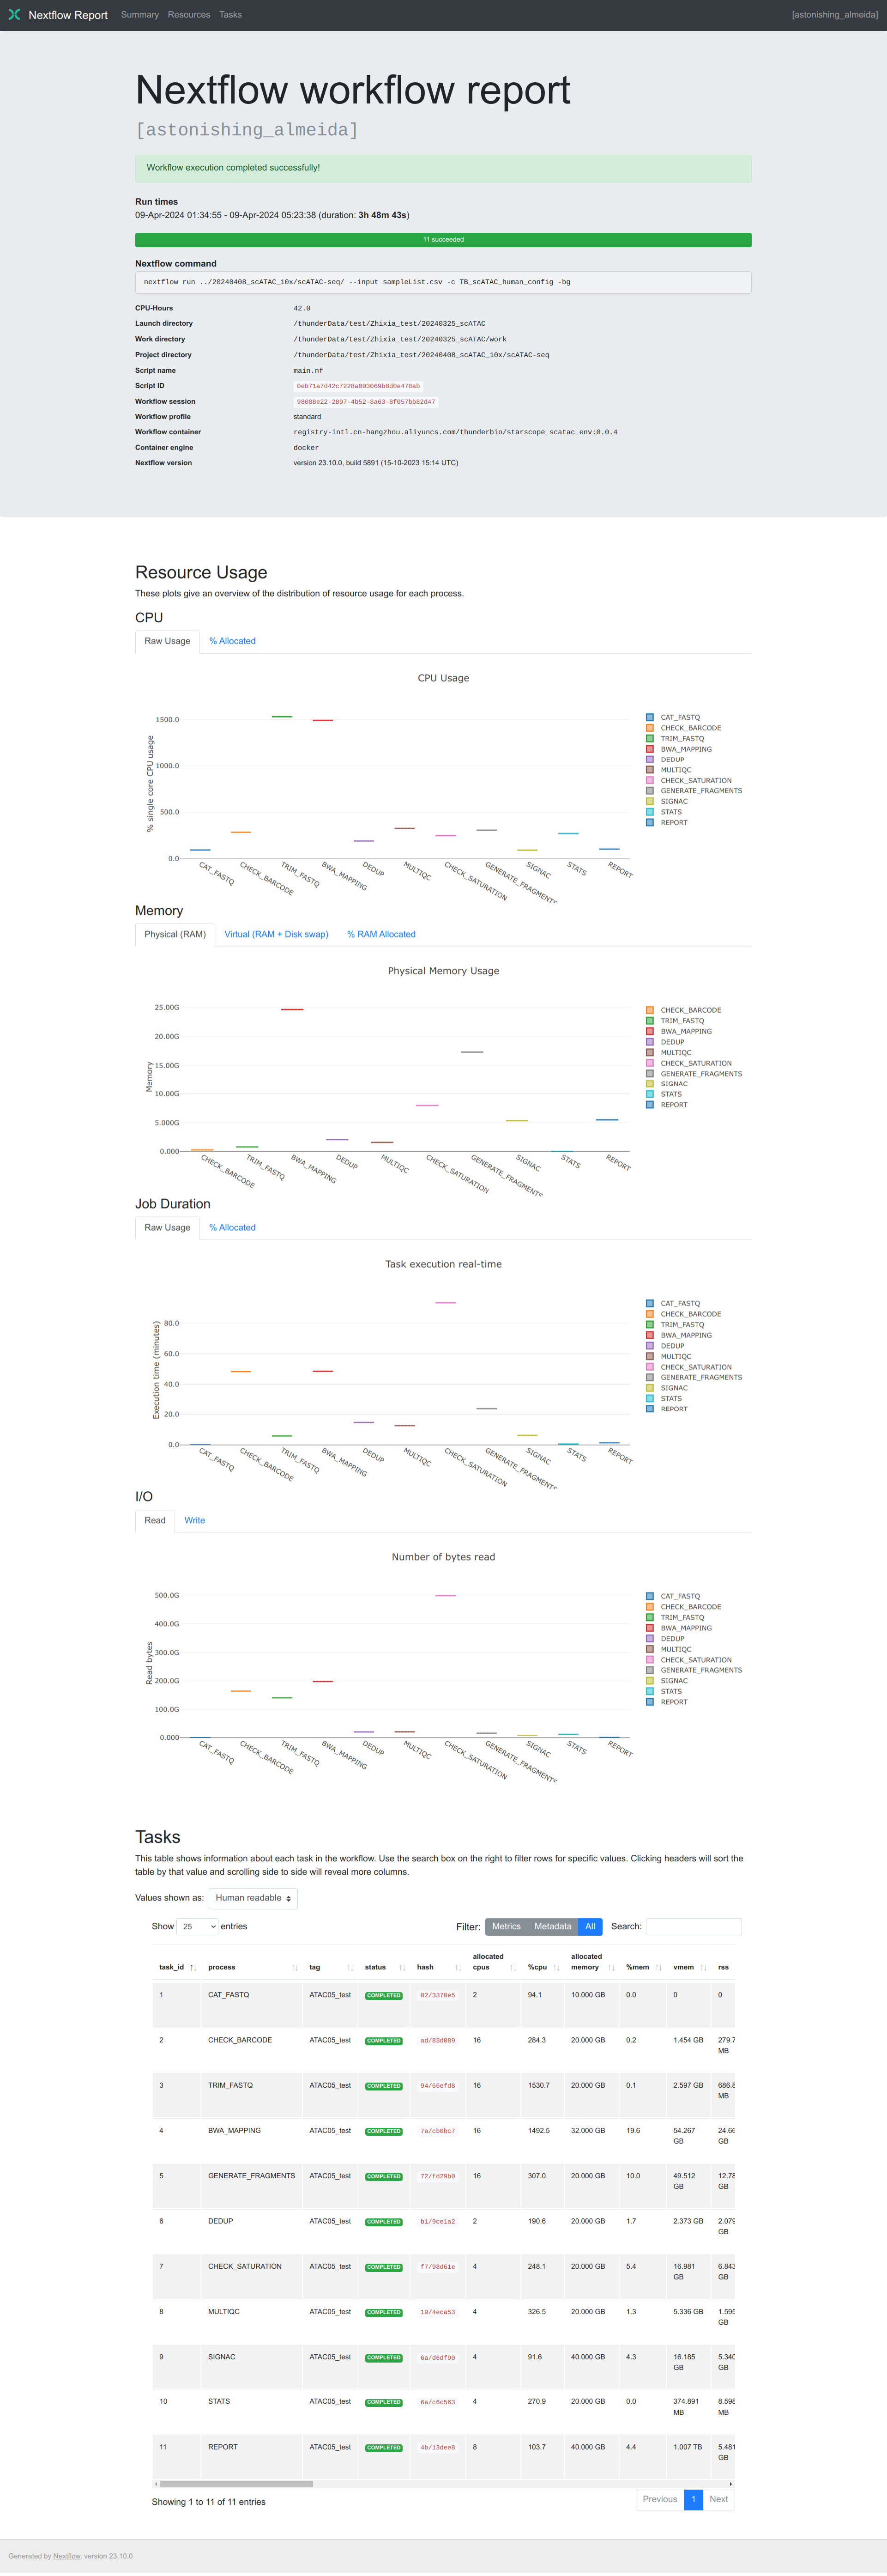
By default, each run of the pipeline will generate
three tracing files in results/pipeline_info/, check
nextflow document for details.
Nextflow generates an execution tracing tsv file with valuable details on each process, including submission time, start time, completion time, CPU usage, and memory consumption.
The content of the trace report will be like:
task_id	hash	native_id	name	status	exit	submit	duration	realtime	%cpu	peak_rss	peak_vmem	rchar	wchar
1	02/3370e5	2820	CAT_FASTQ (ATAC05_test)	COMPLETED	0	2024-04-09 01:34:57.788	4.7s	3ms	94.1%	0	0	90.5 KB	208 B
2	ad/83d089	2821	CHECK_BARCODE (ATAC05_test)	COMPLETED	0	2024-04-09 01:35:02.520	48m 31s	48m 25s	284.3%	280 MB	1.5 GB	164.6 GB	164.2 GB
3	94/66efd8	2822	TRIM_FASTQ (ATAC05_test)	COMPLETED	0	2024-04-09 02:23:33.118	5m 55s	5m 49s	1530.7%	799.8 MB	3.4 GB	141 GB	139.5 GB
4	7a/cb0bc7	2823	BWA_MAPPING (ATAC05_test)	COMPLETED	0	2024-04-09 02:29:28.124	48m 30s	48m 29s	1492.5%	24.7 GB	54.6 GB	198.4 GB	172.4 GB
6	b1/9ce1a2	2824	DEDUP (ATAC05_test)	COMPLETED	0	2024-04-09 03:17:58.183	14m 45s	14m 39s	190.6%	2.1 GB	2.4 GB	21.6 GB	11 GB
8	19/4eca53	2827	MULTIQC (ATAC05_test)	COMPLETED	0	2024-04-09 03:32:43.215	12m 50s	12m 31s	326.5%	1.6 GB	5.4 GB	22.2 GB	23.4 MB
7	f7/98d61e	2826	CHECK_SATURATION (ATAC05_test)	COMPLETED	0	2024-04-09 03:17:58.200	1h 33m 30s	1h 33m 26s	248.1%	8 GB	18.1 GB	498.8 GB	344.1 GB
5	72/fd29b0	2825	GENERATE_FRAGMENTS (ATAC05_test)	COMPLETED	0	2024-04-09 03:17:58.193	1h 57m 30s	24m 2s	307.0%	17.3 GB	51.3 GB	17.4 GB	6.8 GB
9	6a/d6df90	2828	SIGNAC (ATAC05_test)	COMPLETED	0	2024-04-09 05:15:28.385	6m 15s	6m 11s	91.6%	5.3 GB	16.2 GB	9.1 GB	2.1 GB
10	6a/c6c563	2829	STATS (ATAC05_test)	COMPLETED	0	2024-04-09 05:21:43.412	34.9s	32.5s	270.9%	8.6 MB	374.9 MB	13.2 GB	2.1 GB
11 4b/13dee8 2830 REPORT (ATAC05_test) COMPLETED 0 2024-04-09 05:22:18.374 1m 20s 1m 18s 103.7% 5.5 GB 1 TB 329 MB 78.5 MBNextflow can also create an HTML timeline report for all pipeline processes. See example below:
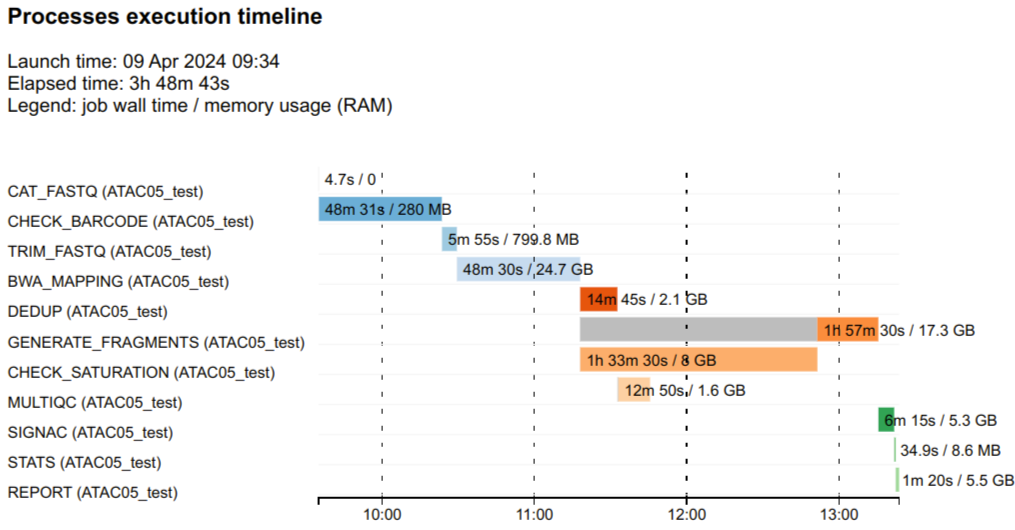
Each bar represents a single process run, the length of the bar represents the duration time (wall-time). Colored part of the bar indicates real processing time, grey part represents scheduling wait time.
The execution report is more concise, which logs running information in the summary section, summarizes task resource usage using plotly.js and collects task metrics like trace report with more terms in a table.